|
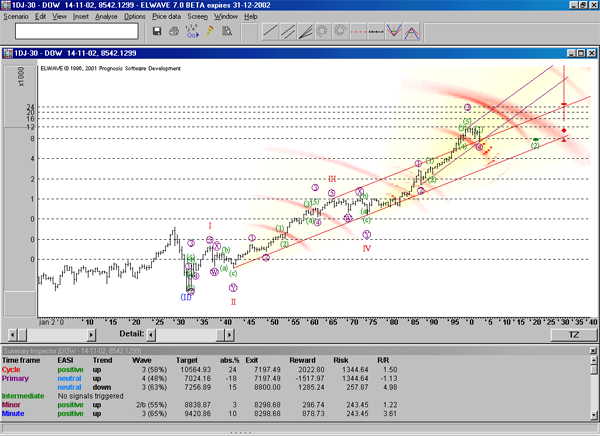
Below you will find an explanation and a screenshot of ELWAVE
which shows the results of the analysis. This is an analysis
of the Dow Jones as of November 14th, 2002. Please note that
the data file starts in 1900(!), therefore very long term
patterns have been analysed.
It is simple!
In the window at the bottom of the chart you find the wave
degrees or time frames listed in the Summary Inspector window,
from the larger time frames to the smallest time frames. The
largest time frame is at the top called "CYCLE"
which EASI (target indicator) is positive
and trend is up. On the same line you will find other information
with regard to this wave degree, but the most important news
is that it has a very positive reading.
At the lowest position in this window you will find "
Minute" time frame which
also shows a positive reading.
With one glance you will notice that the chart above, which
is a very long term chart of the Dow Jones from November 14th
2002, has a positive outlook. It will get even more positive
if the Intemediate and the Primary
time frames turn to positive as well!
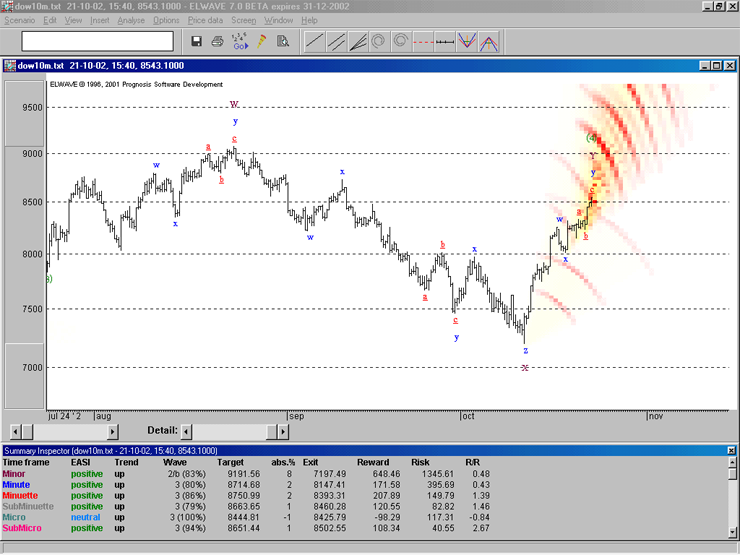
It looks totally different when the outlook is bearish.
The software will tell you without any hesitation. Take a
look at the example below, which display an analysis of March
16, 2002 when the Dow started to decline more and more...Now
the smallest time frames are NEGATIVE!
This is very
much correct looking at the decline that happened thereafter
You can test the outcome in ELWAVE for yourself for
any period you like and for any time frame you like to trade.
For example, if you use 3 months of intraday data, ELWAVE
will analyse very short time frames, which perfectly fit day
traders.
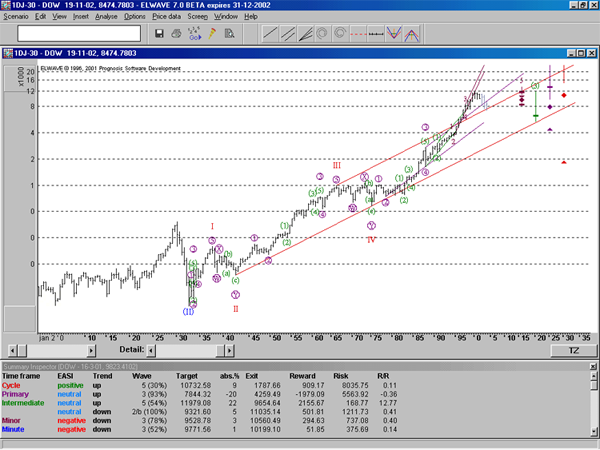
Forecasting an UP TREND
Look at the analysis below.
ELWAVE has analysed the smallest patterns in patterns. All
trends are POSITIVE, forecasting
the further up trend that made the Dow reach 9000 later. In
this case 6 time frames show an uptrend, a very strong signal.
In practice however, it suffices when 2 or 3 time frames show
uptrends, but the more trends are up the stronger the signal.
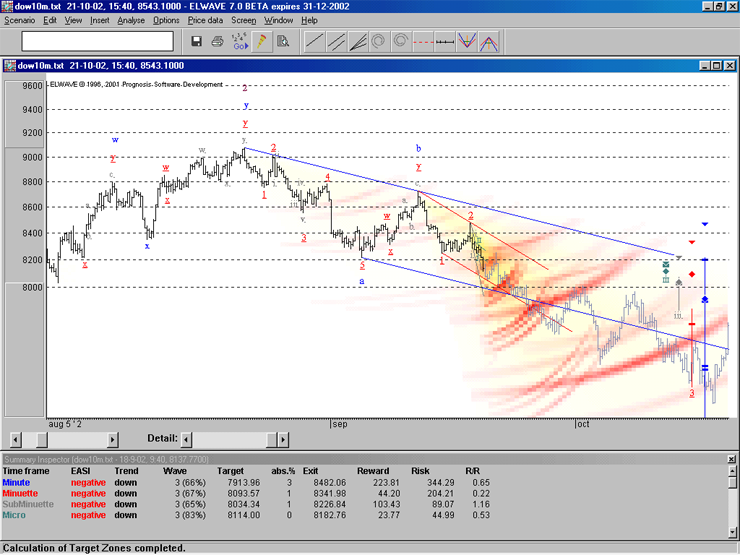
Forecasting an DOWN TREND
Now look at the picture as of September 18th, when the decline
was only just beginning...Look at the Summary Inspector: all
time frames show NEGATIVE and
a down trend! The greyed out data is not part of the analysis,
it shows the actual movement of the stock after the analysis
was made
|